


DISCOVERY & TARGETED PROTEOMICS SERVICES
Service: VPGEL LC-MS/MS
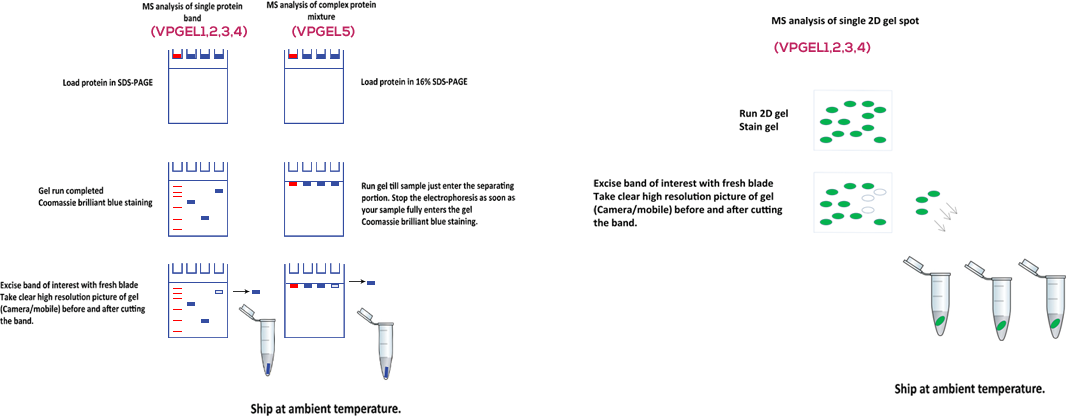
This service is for protein identification from 1D gel bands or 2D gel spots.
Single Coomassie brilliant blue protein band/MS compatible silver staining spot. MS compatible fixed and stained gel band.
Complex mixture analysis of proteins stacked under the border between the stacking and separating gel e.g. pull down complexes, vesicular proteomics, protein fractions etc
Phosphorylation and other PTM analysis of gel separated proteins.
Compatible gels: Any protein band which can be visualized by Coomassie brilliant blue staining or silver staining can be identified using this method. We require high resolution pictures of gel (Coomassie/Silver/Sypro Ruby/2D) before and after band excision
WE ACCEPT GEL BANDS FROM
Coomassie brilliant blue stained gels 1D gel
Silver Stained 1D gel Gels – mass-spec compatible staining methods
Sypro Ruby Stained 1D Gels
2D SDS gel electrophoresis-Coomassie/mass-spec compatible silver staining
PROCEDURE TO PREPARE SAMPLES FOR VPGEL ANALYSIS
FOR ROOM TEMP SHIPMENT
Guidelines for sample preparation
Running protein samples on a gel prior to proteomics analysis has many advantages. Gel removes any foreign particles/substances which are not compatible with downstream analysis using mass spectrometry. The environment we work in is highly polluted with keratin that came from our heads, skin, nails, fingerprints, woolen clothing, and etc. Other rich sources of keratin contamination include paper and cardboard containers. Since mass spectrometers detect proteins at femtomolar levels, the slightest contamination of keratin will result in keratin being identified as the most abundant protein versus being able to identify the proteins that really interest you. Other types of protein contamination such as bovine serum albumin and milk proteins usually come from a staining tray which was previously used to develop a western. Therefore use a brand new staining tray.
SDS PAGE gel: Use high quality reagents for gel preparation, Fresh buffers, and use nitrile gloves for handling the gel, use fresh staining and de-staining solutions. Avoid any dust (Keratin) when gel tray, solutions are exposed to air.
For staining the gels use Coomassie Brilliant Blue or MS-compatible silver staining kits from available vendors.
Non-kit based MS compatible silver staining protocol
- It is strongly recommended that you use Coomassie brilliant blue stain rather than Silver. If you cannot visualize bands with Coomassie try to scale up your isolation to increase the amount of protein until you get to Coomassie detectable limits.
- If you cannot reach Coomassie stainable levels you must use the mass spec compatible Silver Stain protocol below. Only use methanol and acetic acid during the fixing step. Do not use any solutions containing formaldehyde or glutaraldehyde to fix the gel. Refer to Shevchenko et al. (1996) Analytical Chemistry, 68:850-858 for more details.
- It is better to have all the protein in one band/spot, but if you cannot load more protein in one lane then run several lanes and combine the bands/spots.
- Use 1.0 to 1.5mm gels.
- Only stain the gel long enough (usually only a few minutes) to detect the bands of interest.
- Take a picture of the gel and submit it (photocopy or electronic) along with samples.
- Excise gel band(s)/spot(s) with as little excess empty gel as possible. store in 1% acetic acid at 4° C.
- For sample submission, place the gel band(s)/spot(s) into a keratin-free, clean micro centrifuge tube. Ship at ambient temperature.
In case you have used non-compatible silver stain, do let us know to take further steps to get enhance protein recovery.
Protocol for Mass Spec compatible Silver staining 1-10ng detection limit
- Wash your gel with 50%MeOH 10% acetic acid, shaking for 20 minutes.
- Wash with 20% Ethanol, shaking for 10 minutes.
- Wash with water for up to 1 hr, frequently changing the water.
- Rinse with 0.03% sodium thiosulfate 1 min – to sensitize (0.03g/100mL)
- Rinse in water twice very well.
- Immerse into 0.1% Ag nitrate at 4° C for 20 minutes ( 0.1g/100mL)
- Rinse with water twice.
- Chill developer: add 0.04% formalin (40uL/100mL) (formaldehyde) and 2% sodium carbonate per 100mL. Shake until dev. yellow, discard, and continue w/ fresh, cold developer.
- To stop development, add 5% acetic acid to the solution
- Store in 1% acetic acid at 4° C.
Again, however, we strongly encourage users to use Coomassie brilliant blue instead of silver.
We discourage users from submitting silver stained gels for the following reasons:
- Traditional silver stain protocols oxidize amino acid side chains and introduce glutaraldehyde cross-links, interfering with sequence determination. There are kits may reduce amino acid oxidation, but the other reason is,
- Silver staining overestimates the amount of protein that’s actually present in your sample. We still need picomoles (or 100s of femtomoles at the very least) to identify your protein. If you want to identify post-translational modifications (especially phosphorylation) we will need 10X ~ 100X as much material.
Frequently Asked Questions 1
How do I know which stains to use for gel staining and how much protein is required for successful MS analysis?
Ans: For Coomassie brilliant blue staining we recommend to use lab made solutions. Using dust free glassware and fresh solutions are necessary to get good results. Please check the instructions in earlier paragraph for more understanding. You can use commercial available MS compatible stains also for staining the gels. Please excise the gel band of interest as thin as possible with as little excess empty gel as possible. In-principle any Coomassie brilliant blue stained band would be identified by our highly sensitive MS machine. In case of silver staining the detection sensitivity depends on many factors as explained in earlier section. You will provide details regarding your method of protein preparation along with available gel pictures and organism database. We will trypsinize the gel bands ourselves and provide you the best results possible.
I suspect that my sliced gel band may contain many proteins. How do I know which is the right protein for me?
Ans: This is a very common question we face on daily basis. If you have a mixture of protein and many proteins have close molecular mass range as expected they all will be present in the sliced gel piece which you have submitted us for sequencing. In this case all the proteins will be identified by the machine. The relative abundance of proteins in the sliced gel piece will be reflected in the result scores as well as protein coverage. Generally the intense protein in the sliced gel show higher identification scores after data analysis.
I wanted to identify phosphorylation on my protein of interest how much protein is required for successful MS analysis?
Ans: Any Coomassie brilliant blue stained band would be identified by our highly sensitive MS machine at MS and MS/MS level. If a protein sample is in a concentration around 100 fmole/μl, loading 10 μl per lane should result in about 1pmol protein per lane. A protein band of >1 pmol can be visualized by several type of stain (Coomassie colloid, Zn, Cu, etc) and identification of protein in such a gel band is often not very challenging to us. We use state of the art columns, chromatography, mass spec machine and data analysis tools to get best results for you. The maximum coverage of protein depends upon protease digestion efficiency as well as sequencing of peptides inside the mass spec. We use our own Lab controls for checking trypsin digestion efficiency. The stoichiometry of phosphorylated versus non-phosphorylated form in your sample have major role to play in successful identification of phosphorylated peptides. Our machine has sub-femtomole Limit of detection (LOD) and In–principle if we assume that the phosphorylated peptide present in you sample exists in this range and fly well followed by sequencing inside the mass spec machine, we will be able to identify phosphorylation in your sample.
What is the advantage of your nano-ESI MS/MS compared to MALDI-TOF/TOF?
Ans: We utilize chromatography gradients to separate the peptide mixture based on their hydrophobicity. This decreases the complexity of the peptide mixture and thousands of MS and MS/MS scans are performed during the machine run. The machine gets sufficient time to enrich peptides in ion trap before their MS/MS sequencing. In this way not only the coverage of the protein increases but also result in better quality data than MALDI-TOF/TOF. In MALDI-TOF/TOF analysis all the peptides present in the mixture fly simultaneously during laser excitation and operator has to manually decide which MS/MS needs to be performed on the sample based on PMF (MS1) spectrum. In our method the machine utilize very smart automatic technologies like Automatic gain control (AGC) and data dependent acquisition (DDA) to sequence as many peptides as possible in the sample. We provide more coverage, better quality of spectrum and sensitivity compared to any MALDI-TOF/TOF technology available. Our technology very confidently identifies proteins, protein complexes, PTM modifications much better than MALDI-TOF/TOF.
Service: VPSOL LC-MS/MS
FOR LYSATE/PROTEIN MIXTURE BASED PROTEOMICS
This service is generally performed for protein samples prepared in mass spec compatible buffers. The samples must be free from salts, detergents, glycerol, PEG etc which interfere will proteomics analysis. VPSOL services are used to identify global proteome of simple organism like bacteria as well organism containing much more complexity. Bottom-up proteomics requires efficient lysate preparation methods to disaggregate large protein complexes, solubilize membrane bound species and denature larger macromolecules, making sample preparation particularly important in proteomics experiments. Many of the routine cell biology based cell lysis buffers are Mass Spec incompatible e.g. detergents may potentially affect reverse-phase liquid chromatography (RPLC) resolution; while the introduction of these components into the mass spectrometer can lead to a number of problems like suppress peptide ionization, contaminate the ion source and form adducts with peptides. Vproteomics has extensive experience of working with proteomics compatible cell lysis buffer protocols for virus, bacteria, fungi, plants and Animal/cell line systems to determine the most effective protein extraction method.
Please contact us to get more information for your proteomics experiments.
Proteomics Compatible Lysate Preparation:
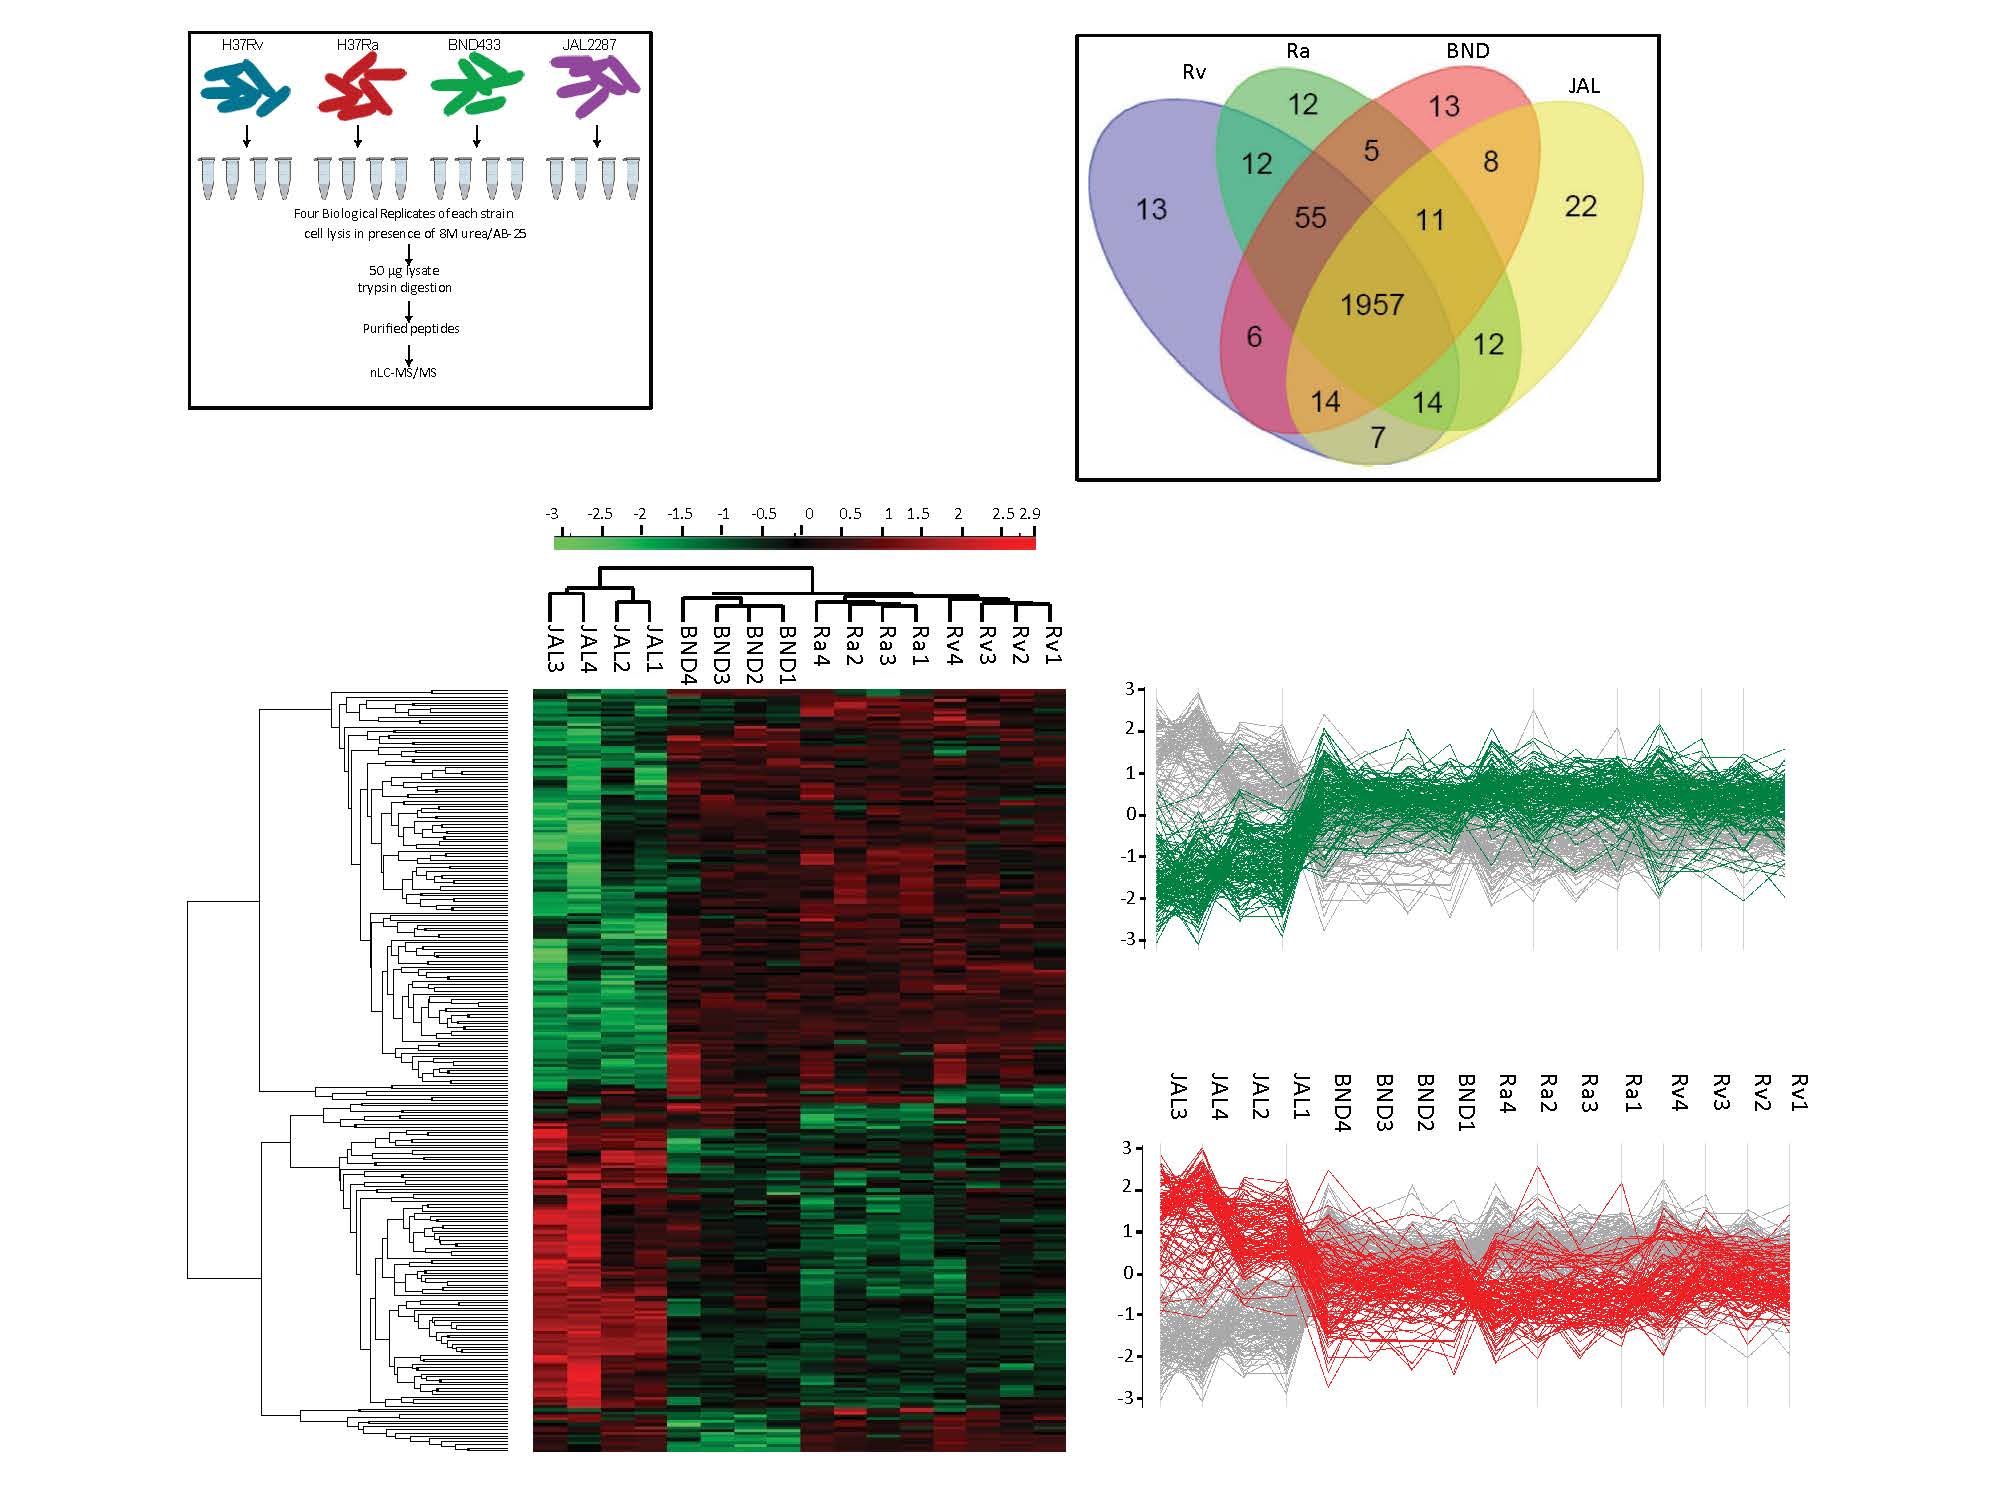
We accept cell extracts prepared in RIPA buffer and many other combinations from clients and perform peptide digestion and extraction in our lab for high quality Mass Spec runs. After discussion with our clients, we suggest the right approaches to prepare proteomics compliant cell lysates for various type of biological samples. There are different protocols to remove detergents, salts, glycerol, PEG and other non-volatile impurities from protein lysates. It is recommended to have minimum steps and manipulations during sample preparation in order to prevent degradation and loss of proteins. If the researcher is interested in both qualitative and quantitative proteomics they must perform the experiment using at least 3 biological replicates to get statistically compliant proteomics results.
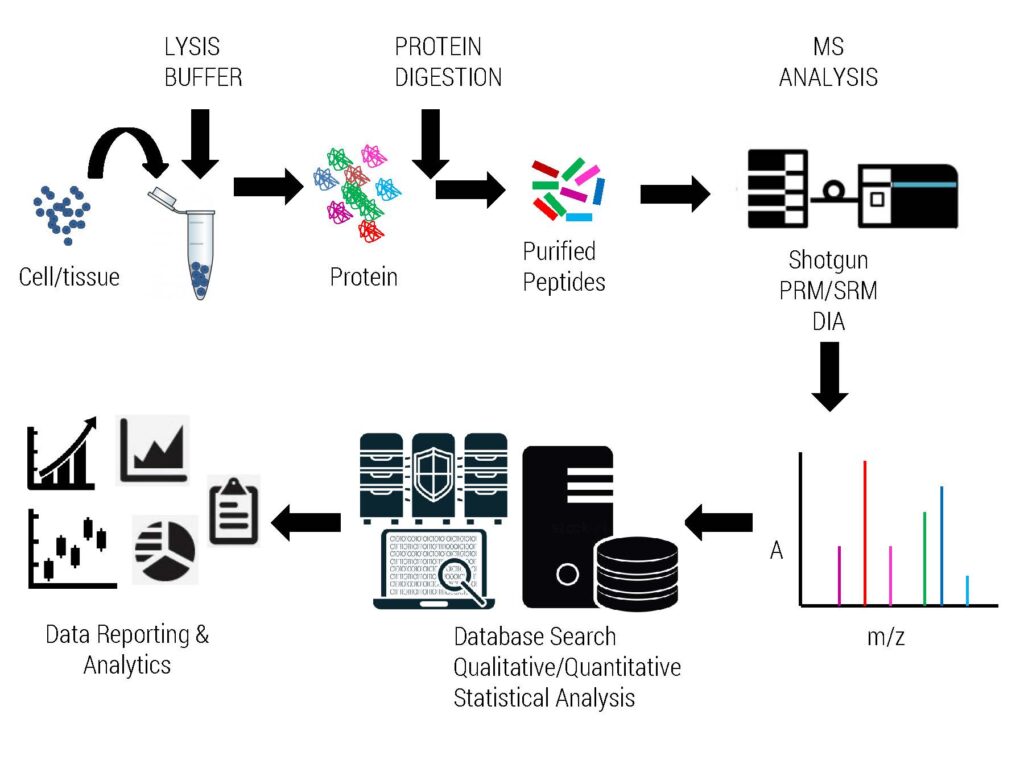
Complete Workflow of Proteomics Experiment

Frequently Asked Questions 2
My samples are in liquid form, how much protein is required for successful MS analysis?
Ans: This actually depends upon the type of experiment. Generally we load 0.5-1 µg of peptide mixture for a single run using 10-15cm column and 1-2µg of peptide mixture using 50 cm long column. If the protein is available in sufficient amount, we recommend trypsin digestion for minimum 25- 50 µg of protein. Please discuss with us your sample preparation protocol to avoid contaminants which may interfere with protein digestion and sample analysis on Mass spec machine. After discussion of the suitable protocol we will get protein samples from you and perform all sample processing and mass spec process in our lab.
What is the advantage of solution based proteome analysis as compared to gel based technique?
Ans: If your samples are having low level of complexity, we recommend running them on SDS-PAGE gel which removes contaminants and MS interfering substances. Just run for short time to allow the mixture of proteins to enter the stacking gel and concentrate as a coarse band (Check VPGEL sample processing figure, VPGEL5). But not all the proteins are resolved well in SDS-PAGE gel especially membrane proteins. If you are preparing complex cell lysates using a proteomics compatible lysis buffer in that case solution based methodology provides better results than gel based approaches in terms of number of peptides and protein identification with our top of the line Mass Spectrometry Exploris Machine and standardized protocols, we generally identify 5000-6000 proteins routinely in complex protein lysates e.g. HeLa in a single Mass Spec run.
Some experiments e.g. Pull down analysis, Protein-protein interaction, where starting material and resulting eluate protein concentration is very limiting gel based analysis may not be possible due to invisibility of protein bands in stained gel. In these special cases we recommend to use the VPSOL approach for mass spec analysis which results in identification of most of the proteins (high, medium & low levels) present in the IP complex. Please discuss with us your experimental requirements and we will be happy to provide you right strategy for successful outcome.
PROTEIN IDENTIFICATION :
FOR ALL PURPOSE
Reliable and sensitive identification of proteins from low-complex (e.g. single gel spots, purified protein etc.) as well as complex samples by our standard protein identification workflow (VPGEL & VPSOL). Proteins are first digested to peptides using suitable proteases (gel-based or gel-free/in solution) and then analyzed by nano-ESI-LCMS/MS.
- Sample preparation service
- Digestion (in-gel or in solution) service
- Molecular weight determination and molecular weight distribution of peptides or proteins service
- Purity analysis of peptides or proteins service
- Peptide mass fingerprinting service
- Sequence analysis of peptides or proteins
- Shotgun protein identification service
- Accurate mass determination service
- Membrane proteomics service
- Subcellular proteomics service
- Sequencing of recombinant protein
PROTEIN POST-TRANSLATIONAL MODIFICATION ANALYSES
We perform the analyses of various posttranslational modifications (PTMs), for example phosphorylation, Acetylation, etc. Please contact us for details and to discuss your specific project. 
- Phosphorylation analysis
- Methylation analysis
- Acetylation analysis
- Ubiquitination analysis
- Nitrosylation analysis
- Di-Sulfide bond localization
- Customer-tailored service
Image Courtesy dbPTM
PHOSPHORYLATION SITE MAPPING &
QUANTITATIVE PHOSPHOPROTEOMICS
FOR CELL SIGNALLING
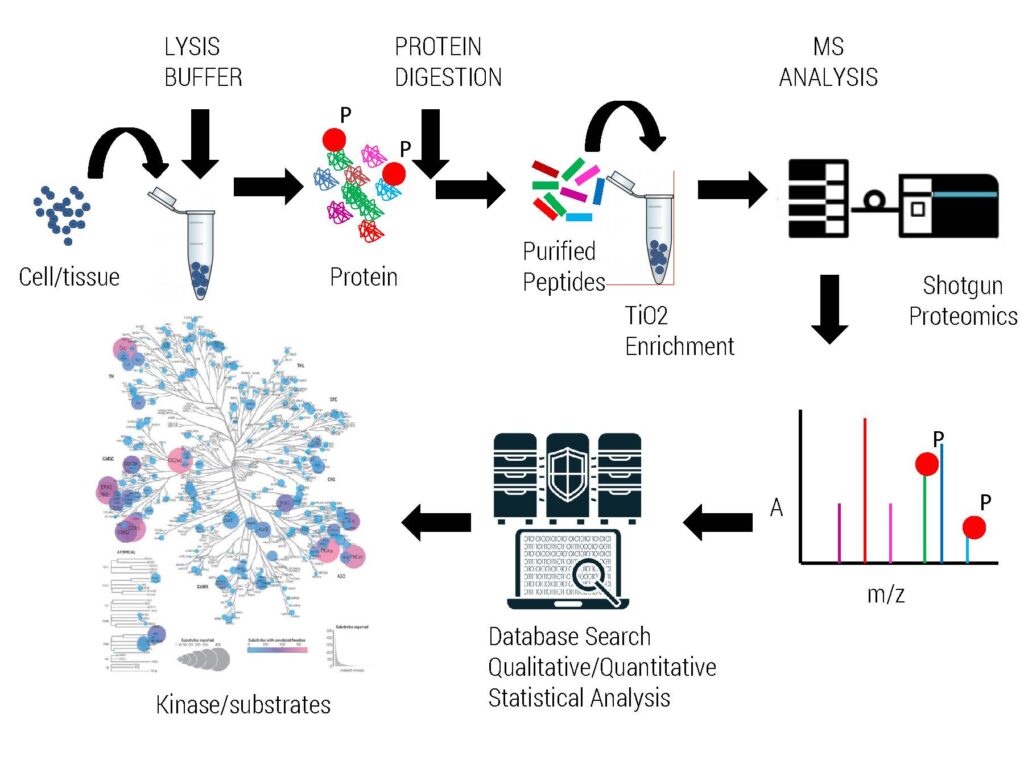
We routinely perform global phosphoproteomics analysis for our clients using IMAC or TiO2 enrichment procedure.
We require 2-10 mg of proteomics compatible cell lysates to enrich phosphopeptides from various organisms.
High resolution Orbitrap Mass Spectrometry is utilized to identify intact phosphorylation sites resulting in better sequencing coverage of protein of interest as well as PTM modifications. Protein samples are accepted for analysis which are derived from 1D, 2D gel, IP & pull down experiments demonstrating good intensity by Coomassie staining. This service is routinely used for kinase substrate phosphorylation mapping as well as PTM status of pull down/IP complexes.
Global Phosphoproteomics is performed via our in-house developed TiO2 based protocol yielding high specificity and number of phosphopeptides. Generally mammalian cell lines derived samples and our standardized protocols results in enrichment of thousands of phosphoproteins/phosphopeptides as per the best international standards available. The quantity of whole cell extract requirement for phosphoenrichment protocol in our lab varies based on sample origin and extent of expected phosphorylation present in an organism. We generally require input lysate amounts ranging from 2mg-8mg depending upon organism of interest. For statistically significant differential proteomics/phosphoproteomics, we recommend to have atleast 3 biological replicates of each experimental condition.
QUANTITATIVE PROTEOMICS FOR DIFFERENTIAL PROTEOMICS
We offer several quantification strategies:
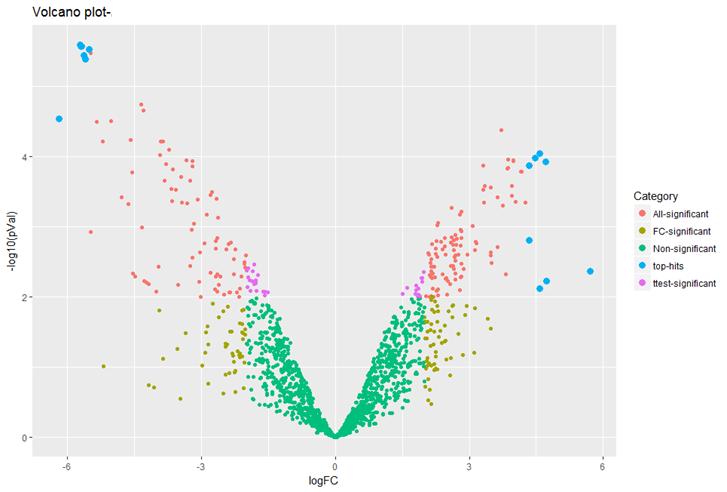
Unbiased proteomic studies can be performed using our high resolution Orbitrap mass spectrometers to provide accurate quantification data. We provide Label-free methods for both relative and absolute quantification, which are rapid and a low-cost alternative to other quantitative proteomic approaches. For differential proteomics analysis experiments, we generally recommend 3-4 biological replicates each condition to result in proper statistical analysis.
- SILAC: stable isotope labeling of amino acids in cell culture,a global method whereby all translated proteins have isotope labels metabolically incorporated at selected amino acid residues;
- ICAT: isotope-coded affinity tags, a technique that labels cysteine residues at the protein level
- iTRAQ/TMT : multiplexed isobaric tags for relative and absolute quantification.
- Label-free: approaches for quantitative proteomics have gained prominence in recent years and is utilized by top labs in the world since no additional chemistry or sample preparation steps are required. Our lab is offering DDA and DIA based LFQ proteomics for all kind of organism samples, numbers ranging to 100’s of samples without restrictions associated with labeling kit plexing and this technology is the preferred technology in our lab for all kind of differential proteomics experiments. Clients can provide cell line pellet/tissues/biofluids or compatible lysates for LFQ proteomics.
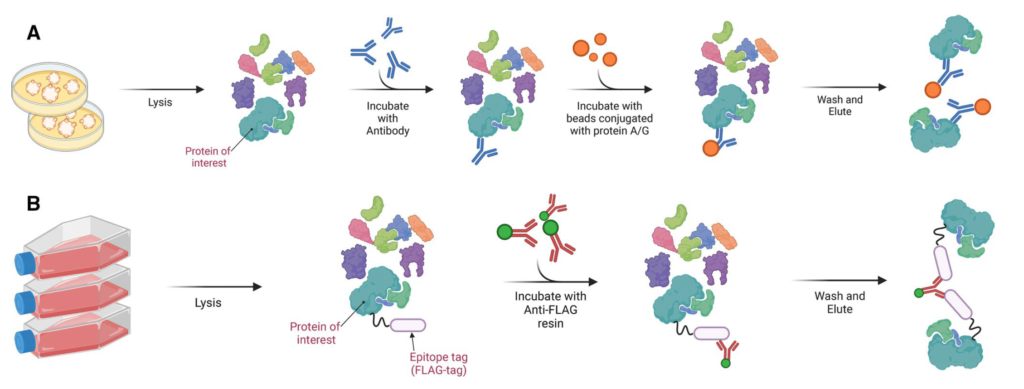
INTERACTOMICS/PROTEIN-PROTEIN INTERACTION
Co-IP or co-affinity purification MS
For the bulk identification of protein interaction partners, we commonly apply co-immunoprecipitation/co-affinity purification together with quantitative Mass-Spectrometry. For this, the protein of interest is enriched from the cells together with its interacting proteins, which are subsequently identified by mass spectrometry. Because such enrichment mixtures also contain contaminants (e.g. unspecific binders to affinity beads, IgG beads, antibody), a control sample not containing the bait is needed. In the end, true interactors can be distuinguished from contaminants by looking at their respective abundances in both samples. While contaminants are present in both samples, specific interactors are enriched in the bait sample.
Clients needs to provide two samples: Control without bait and experimental sample with bait protein. Mass Spec will identify bait protein, interacting proteins and contaminants (non-specific binders).
We suggest to use covalently crosslinked antibodies to avoid heavy background of antibody chains in the final elution mixtures.
The various applications where protein-protein interactions can be identified using Affinity purified Mass Spectrometry (AP-MS) are GST/MBP/HIS/FLAG/HA/Strep/TAP tag pull down etc.
DATA INDEPENDENT AQUISITION
One of the biggest challenges in discovery proteomics is the identification and precise quantification of protein abundances in highly complex samples that can consist of thousands of proteins. The number of peptides released by these proteins during the sample preparation is high and generally exceeds the maximal number of spectra that can be acquired in the traditional data-dependent acquisition (DDA) workflows (also referred to as ‘shotgun’ proteomics). This known problem of undersampling can be circumvented by using an alternative acquisition method.
In data-independent acquisition (DIA) mode, all ions of the entire mass range are sequentially isolated in broader m/z windows and fragmented together. The resulting highly complex fragment spectra derive from multiple precursor ions what makes the data-analysis highly complex. One strategy to identify peptides at high confidence is based on peptide spectral libraries. Recent improvements in technology and software tools now enable identification of thousands of proteins using DIA methodologies with precise peptide identification and quantification (median CVs below 10%). peptide identification and quantification.
With our top of the line Mass Spectrometry Exploris Machine and standardized protocols, we generally identify 5000 or more proteins routinely in complex protein lysates e.g. HeLa in a single DIA Mass Spec run.
We also provide custom made project support for DIA analysis including library free as well as sample specific library generation and data analysis.

Selected/Parallel Reaction Monitoring
FOR TARGETED PROTEOMICS
High sensitivity, High Throughput, Easy Assay Development
Selected reaction monitoring (SRM/MRM) is a method used in tandem mass spectrometry on triple quadrupole mass spectrometers in which an ion of a particular mass is selected in the first stage of a tandem mass spectrometer and an ion product of a fragmentation reaction of the precursor ion is selected in the second mass spectrometer stage for detection.
SRM/MRM can be used for targeted quantitative proteomics by mass spectrometry. Following ionization in, for example, an electrospray source, a peptide precursor is first isolated to obtain a substantial ion population of mostly the intended species. This population is then fragmented to yield product ions whose signal abundances are indicative of the abundance of the peptide in the sample. This experiment can be performed on triple quadrupole mass spectrometers, where mass-resolving Q1 isolates the precursor, q2 acts as a collision cell, and mass-resolving Q3 is cycled through the product ions which are detected upon exiting the last quadrupole by an electron multiplier. A precursor/product pair is often referred to as a transition. Much work goes into ensuring that transitions are selected that have maximum specificity.
Using isotopic labeling with heavy-labeled (e.g., D, 13C, or 15N) peptides to a complex matrix as concentration standards, SRM can be used to construct a calibration curve that can provide the absolute quantification (i.e., copy number per cell) of the native, light peptide, and by extension, its parent protein.
PRM (parallel reaction Monitoring) is based on high resolution mass spectrometer i.e. Q-Orbitrap .In PRM Orbitrap replaces Q3 and scans all product ions with high resolution and high accuracy. Therefore, PRM technology not only has the SRM/MRM target quantitative analysis capabilities, but also have the qualitative ability.
Our clients require PRM services to validate their candidate proteins identified using routine discovery proteomics.
